Gantt Charts are hardly ever explored as a way of organizing. Although not a whole lot of entrepreneurs know about them, those that do, utilize Gantt Charts to the fullest extent.
For great reason at that.
Created in 1910 by Henry Gantt, his newfound chart was designed to help manufacturing supervisors see whether their work was on, ahead, or behind schedule. This was later adapted into all fields of business, namely construction, and the benefits were bountiful.
What Does a Gantt Chart Look Like?
One of the main benefits to using Gantt Charts is its ability to convey information visually in an easy-to-understand format. Below is an example of Gantt Chart, courtesy of DHTMLX.
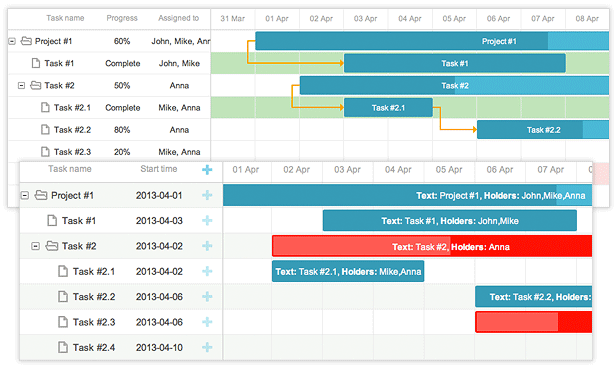
From just looking at this example, you can tell that:
- All information relevant to scheduling can be viewed at a glance
- Tasks are easily organized and can be kept in specific group folders
- Different groups can be kept on the same page to maintain communication
The clarity offered by this type of chart is great because it allows for stakeholders in an organization to view progress, all the while grasping the ways in which independent elements come together toward project completion.
Time Management is far better when using Gantt Charts.
Because these charts are so easy to digest, workers and employers will find the information they need quickly.
The format also helps teams understand the overall impact of project delays. This can foster stronger collaboration while encouraging better task organization.
Gantt Charts also help guarantee that the schedule is manageable. Users can ensure that the right people are assigned for each task and that there are workarounds for potential problems before the whole process begins.
This saves an extraordinary amount of time as well as prevents any unnecessary stretch from piling up.
To go in-depth:
- Gantt Charts guarantee the minimum time it will take to complete
- They identify which tasks need to be completed for others to begin
- They also pave and lay out the critical path to completion
For those unaware, the critical path is the sequence of tasks that must be individually completed on time if the whole project is to be completed on time. This, in essence, keeps the team and any sponsor informed of the progress.
Let’s go a little deeper into the Organization aspect. Specifically Planning.
The true beauty of a Gantt Chart isn’t just the pretty colors or the easy-to-view information. As we briefly mentioned before, Gantt Charts guarantee the minimum time it will take to complete a project. But how?
The premise behind a Gantt Chart is that the user is capable of creating a sort of ‘road map’ to project completion with ease.
Through the planning stages, you can plan the most optimal order of tasks to be completed until the project is done. This way, you can guarantee the minimum time and maximum effort.
And it goes a little further than that.
Users can pick and choose which employee is best suited for the tasks, and from there highlight which tasks need to be completed for others to begin. This feature makes great use of the idea of efficiency and ‘no wasted effort.’
Now, problems are inevitable. They happen whether we like it or not, and usually, we don’t. With the superior organization that comes with Gantt Charts, managers can plan for any potential disasters.
Workarounds can be made in the event a task or job can’t be completed due to some circumstance. This makes sure that the project can still go along smoothly.
To add to all that, a Gantt Chart makes planning and scheduling much more effective. They help to visualize dependencies and resource availability. On top of that, these charts provide a means to quickly see scheduling conflicts.
We might not like to think about it, but Accountability is an issue.
Let’s face it. Nobody likes to play the blame game and point fingers. It just makes us all uncomfortable.
But sometimes, it’s necessary.
When project teams face major organizational change, keeping track of tasks, effort, and results becomes vital to success and maintenance. Gantt Charts do just that.
They allow both project managers and participants to keep track of team progress. From there, both major successes and failures can be highlighted.
This information can then be used for analysis, finding out what works and what doesn’t. All that is pivotal for growth and success.
Final Thoughts
Through the easy-to-digest information to effective scheduling and team maintenance, we are huge fans of Gantt Charts. They offer a tremendous amount of luxurious convenience. Designed to help manufacturing supervisors see where on the schedule their project is at, Gantt Charts revolutionize the business industry.
If you’re looking for more Software features like Gantt Charts, have a swing at our Software Features section by clicking Here!